Grundlæggende statistik
| Institutionelle aktier (lange) | 327.408.125 - 50,69% (ex 13D/G) - change of 3,80MM shares 1,45% MRQ |
| Institutionel værdi (lang) | $ 41.642.218 USD ($1000) |
Institutionelt ejerskab og aktionærer
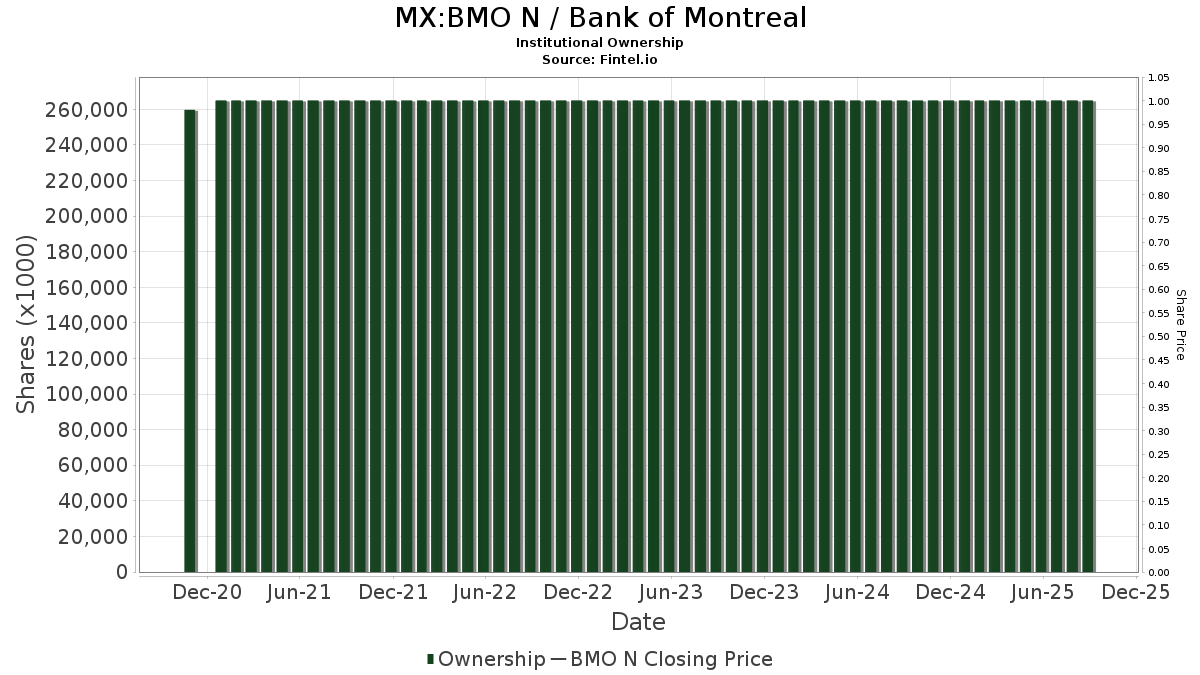
Bank of Montreal (MX:BMO N) har 629 institutionelle ejere og aktionærer, der har indsendt 13D/G- eller 13F-formularer til Securities Exchange Commission (SEC). Disse institutioner har i alt 327,408,125 aktier. Største aktionærer omfatter Royal Bank Of Canada, Vanguard Group Inc, Bank Of Montreal /can/, Td Asset Management Inc, CIBC World Markets Inc., National Bank Of Canada /fi/, 1832 Asset Management L.P., FIL Ltd, Mackenzie Financial Corp, and Norges Bank .
Bank of Montreal (BMV:BMO N) institutionel ejerskabsstruktur viser aktuelle positioner i virksomheden efter institutioner og fonde, samt seneste ændringer i positionsstørrelse. Større aktionærer kan omfatte individuelle investorer, investeringsforeninger, hedgefonde eller institutioner. Skema 13D angiver, at investoren besidder (eller besidder) mere end 5 % af virksomheden og har til hensigt (eller har til hensigt at) aktivt at forfølge en ændring i forretningsstrategi. Skema 13G indikerer en passiv investering på over 5%.
Fondens stemningsscore
Fund Sentiment Score (fka Ownership Accumulation Score) finder de aktier, der bliver mest købt af fonde. Det er resultatet af en sofistikeret, multi-faktor kvantitativ model, der identificerer virksomheder med de højeste niveauer af institutionel akkumulering. Scoringsmodellen bruger en kombination af den samlede stigning i oplyste ejere, ændringerne i porteføljeallokeringer i disse ejere og andre målinger. Tallet går fra 0 til 100, hvor højere tal indikerer et højere niveau af akkumulering for sine jævnaldrende, og 50 er gennemsnittet.
Opdateringsfrekvens: Dagligt
Se Ownership Explorer, som giver en liste over højest rangerende virksomheder.
AI+ Ask Fintel’s AI assistant about Bank of Montreal.
Select a question to share a public post with an AI-crafted answer.
Thinking of good questions…
13F og NPORT arkivering
Detaljer om 13F-arkivering er gratis. Detaljer om NP-ansøgninger kræver et premium-medlemskab. Grønne rækker angiver nye positioner. Røde rækker angiver lukkede positioner. Klik på linket ikon for at se den fulde transaktionshistorik.
Opgrader
for at låse premium-data op og eksportere til Excel ![]() .
.
| Fil dato | Kilde | Investor | Type | Gennemsnitlig pris (Øst) |
Aktier | Δ Aktier (%) |
Rapporteret Værdi ($1000) |
Δ Værdi (%) |
Port Alloc (%) |
|
|---|---|---|---|---|---|---|---|---|---|---|
| 2026-02-17 | 13F | Millennium Management Llc | Put | 470.000 | -25,40 | 83.778 | -26,67 | |||
| 2026-02-17 | 13F | Millennium Management Llc | 251.707 | 1.266,56 | 32.683 | 1.262,32 | ||||
| 2026-02-11 | 13F | CLARET ASSET MANAGEMENT Corp | 89.014 | 0,52 | 12 | 0,00 | ||||
| 2026-02-12 | 13F | UniSuper Management Pty Ltd | 13.900 | 12,10 | 2.478 | 10,19 | ||||
| 2026-02-10 | 13F | Godfrey Financial Associates, Inc. | 23 | 3 | ||||||
| 2026-01-26 | 13F | AE Wealth Management LLC | 3.185 | -10,23 | 413 | -10,61 | ||||
| 2026-02-11 | 13F | Fiera Capital Corp | 3.981.598 | 0,36 | 517.251 | 0,19 | ||||
| 2026-02-11 | 13F | Zions Bancorporation, National Association /ut/ | 32.281 | -44,32 | 4.190 | -44,52 | ||||
| 2025-11-04 | 13F | State of Wyoming | 0 | -100,00 | 0 | |||||
| 2026-02-17 | 13F | Worldquant Millennium Advisors Llc | 10.645 | -48,38 | 1.383 | -48,57 | ||||
| 2026-04-22 | 13F | Romano Brothers And Company | 49.563 | -1,34 | 6.708 | 2,87 | ||||
| 2026-02-17 | 13F | Royal Bank Of Canada | 50.087.971 | -23,49 | 6.500.919 | -23,76 | ||||
| 2026-04-22 | 13F | Stone House Investment Management, LLC | 10 | 0,00 | 1 | 0,00 | ||||
| 2026-02-13 | 13F | Archetype Wealth Partners | 2.557 | 0,00 | 0 | |||||
| 2026-02-13 | 13F | Pathstone Holdings, LLC | 13.257 | 2,82 | 1.721 | 2,44 | ||||
| 2026-02-13 | 13F | Nicolet Advisory Services, Llc | 5.401 | 2,76 | 723 | 6,95 | ||||
| 2026-02-13 | 13F | Healthcare Of Ontario Pension Plan Trust Fund | 3.267.462 | -0,16 | 424.377 | -0,46 | ||||
| 2026-02-12 | 13F | Xponance, Inc. | 4.489 | 584 | ||||||
| 2026-02-12 | 13F | Triumph Capital Management | 56 | -25,33 | 7 | -22,22 | ||||
| 2026-02-12 | 13F | Voya Investment Management Llc | 0 | -100,00 | 0 | |||||
| 2026-01-21 | 13F | Flagship Harbor Advisors, Llc | 262 | 34 | ||||||
| 2026-02-13 | 13F | Osmosis Investment Management UK Ltd | 51.988 | 6.758 | ||||||
| 2026-04-24 | 13F | Bayban | 489 | -83,38 | 66 | -82,68 | ||||
| 2026-01-15 | 13F | Nisa Investment Advisors, Llc | 68 | 9 | ||||||
| 2026-02-17 | 13F | Janus Henderson Group Plc | 62.227 | 10,87 | 8.097 | 11,02 | ||||
| 2026-02-13 | 13F | Virtus ETF Advisers LLC | 504 | 0,80 | 90 | -1,11 | ||||
| 2026-02-13 | 13F | Ieq Capital, Llc | 6.864 | 6,14 | 891 | 5,70 | ||||
| 2026-02-10 | 13F | Winthrop Capital Management, LLC | 1.105 | 0 | ||||||
| 2026-02-17 | 13F | Cetera Investment Advisers | 51.967 | 2,05 | 6.745 | 1,69 | ||||
| 2026-01-15 | 13F | J. Safra Sarasin Holding AG | 1.545 | 201 | ||||||
| 2026-02-13 | 13F | Mariner, LLC | 58.023 | 10,70 | 7.533 | 10,33 | ||||
| 2026-04-07 | 13F | CoreCap Advisors, LLC | 12 | 0,00 | 2 | 0,00 | ||||
| 2026-02-03 | 13F | American Assets Investment Management, LLC | 96.000 | 0,00 | 12.460 | -0,36 | ||||
| 2026-02-02 | 13F | Oppenheimer Asset Management Inc. | 0 | -100,00 | 0 | |||||
| 2026-02-13 | 13F | Stifel Financial Corp | 123.490 | -16,36 | 16.028 | -16,66 | ||||
| 2026-02-04 | 13F | Patrick M Sweeney & Associates, Inc | 4.453 | -1,22 | 578 | -1,70 | ||||
| 2026-04-24 | 13F | Triasima Portfolio Management inc. | 140.804 | 21,21 | 19.011 | 25,84 | ||||
| 2026-02-10 | 13F | Ilmarinen Mutual Pension Insurance Co | 23.701 | 0,00 | 3 | 0,00 | ||||
| 2026-02-12 | 13F | Principal Securities, Inc. | 0 | -100,00 | 0 | -100,00 | ||||
| 2026-02-19 | 13F | Invesco Ltd. | 1.576.288 | -1,87 | 204.586 | -2,22 | ||||
| 2026-01-28 | 13F | Schmidt P J Investment Management Inc | 1.773 | -0,11 | 230 | -0,43 | ||||
| 2026-04-13 | 13F | Creative Financial Designs Inc /adv | 6 | 0,00 | 1 | |||||
| 2026-04-21 | 13F | Old National Bancorp /in/ | 1.953 | -23,17 | 264 | -19,76 | ||||
| 2026-02-17 | 13F | Two Sigma Investments, Lp | 76.440 | -50,51 | 9.921 | -50,68 | ||||
| 2026-02-17 | 13F | VestGen Advisors, LLC | 4.343 | 27,03 | 564 | 26,52 | ||||
| 2026-02-17 | 13F | United Capital Financial Advisers, Llc | 2.782 | 6,22 | 361 | 5,87 | ||||
| 2026-04-22 | 13F | Princeton Global Asset Management LLC | 100 | 0,00 | 14 | 8,33 | ||||
| 2026-02-13 | 13F | Prudential Financial Inc | 9.170 | -26,67 | 1.191 | -26,89 | ||||
| 2026-04-16 | 13F | First Merchants Corp | 2.716 | 0,00 | 368 | 4,26 | ||||
| 2026-02-04 | 13F | Atlantic Union Bankshares Corp | 0 | -100,00 | 0 | |||||
| 2026-02-05 | 13F | Bank Julius Baer & Co. Ltd, Zurich | 1.303 | 169 | ||||||
| 2026-02-13 | 13F | Vontobel Holding Ltd. | 107.319 | -2,37 | 13.938 | -2,67 | ||||
| 2026-02-17 | 13F | State Of Wisconsin Investment Board | 259.753 | 33.778 | ||||||
| 2026-04-17 | 13F | CENTRAL TRUST Co | 555 | 0,00 | 75 | 4,17 | ||||
| 2026-02-10 | 13F | JTC Employer Solutions Trusteee Ltd | 1.707 | 7,02 | 0 | |||||
| 2026-04-13 | 13F | JCIC Asset Management Inc. | 61.364 | 1,78 | 8.295 | 5,93 | ||||
| 2026-04-22 | 13F | Summerhill Capital Management lnc. | 2.907 | 393 | ||||||
| 2026-04-23 | 13F | Oppenheimer & Co Inc | 4.156 | 562 | ||||||
| 2026-02-10 | 13F | Turn8 Private Wealth Inc. | 11.122 | 0,94 | 1.445 | 0,63 | ||||
| 2026-02-10 | 13F | Quantbot Technologies LP | 12.693 | 1.647 | ||||||
| 2026-01-29 | 13F | RMG Wealth Management LLC | 2 | 0 | ||||||
| 2026-02-11 | 13F | Buckingham Strategic Partners | 2.677 | -28,13 | 347 | -26,95 | ||||
| 2026-01-28 | 13F | HB Wealth Management, LLC | 4.650 | 11,91 | 604 | 11,46 | ||||
| 2025-11-13 | 13F | Arrowstreet Capital, Limited Partnership | 0 | -100,00 | 0 | |||||
| 2026-01-27 | 13F | Checchi Capital Advisers, LLC | 3.053 | -2,49 | 396 | -2,70 | ||||
| 2026-01-29 | 13F | DecisionPoint Financial, LLC | 18 | 2 | ||||||
| 2026-01-21 | 13F | Raleigh Capital Management Inc. | 9.168 | -24,42 | 1.190 | -24,70 | ||||
| 2026-01-29 | 13F | UBS Group AG | 518.524 | -75,63 | 67.299 | -75,71 | ||||
| 2026-04-06 | 13F | GAMMA Investing LLC | 1.647 | 2,68 | 223 | 6,73 | ||||
| 2026-02-13 | 13F | OMERS ADMINISTRATION Corp | 1.244.155 | 9,82 | 161.788 | 9,56 | ||||
| 2026-02-10 | 13F | Envestnet Asset Management Inc | 331.169 | -23,60 | 42.982 | -23,87 | ||||
| 2026-02-17 | 13F | Alliancebernstein L.p. | 68.590 | -0,90 | 8.902 | -1,24 | ||||
| 2026-01-23 | 13F | Altfest L J & Co Inc | 1.620 | 0,00 | 210 | -0,47 | ||||
| 2026-04-10 | 13F | Country Trust Bank | 62 | -33,33 | 8 | -33,33 | ||||
| 2026-04-21 | 13F | Pinnacle Associates Ltd | 33.600 | 0,00 | 4.547 | 4,29 | ||||
| 2026-03-17 | 13F | Employees Provident Fund Board | 0 | -100,00 | 0 | |||||
| 2026-02-12 | 13F | Andra AP-fonden | 0 | -100,00 | 0 | |||||
| 2026-02-11 | 13F | TruNorth Capital Management, LLC | 0 | -100,00 | 0 | -100,00 | ||||
| 2026-02-10 | 13F | Argent Trust Co | 2.487 | -10,28 | 323 | -10,80 | ||||
| 2026-02-04 | 13F | Versor Investments LP | 2.299 | 299 | ||||||
| 2026-01-28 | 13F | CAPROCK Group, Inc. | 4.821 | 1,20 | 626 | 8,51 | ||||
| 2026-02-05 | 13F | Atria Investments Llc | 13.404 | -22,17 | 1.740 | -22,47 | ||||
| 2026-02-11 | 13F | O'shaughnessy Asset Management, Llc | 167.805 | 5,10 | 21.789 | 4,76 | ||||
| 2026-02-06 | 13F | Intrust Bank Na | 3.501 | -5,63 | 454 | -6,00 | ||||
| 2026-02-11 | 13F | Manchester Capital Management LLC | 1.387 | 180 | ||||||
| 2026-02-17 | 13F | Creative Planning | 65.270 | 4,77 | 8.471 | 4,40 | ||||
| 2026-03-20 | 13F | Purpose Unlimited Inc. | 301.031 | 39.094 | ||||||
| 2025-11-14 | 13F | Chiron Capital Management, Llc | 0 | -100,00 | 0 | |||||
| 2026-02-13 | 13F | Canerector Inc | 125.000 | 0,00 | 22.281 | -1,71 | ||||
| 2026-02-04 | 13F | Asahi Life Asset Management Co., Ltd. | 2.688 | 350 | ||||||
| 2026-02-05 | 13F | Thrivent Financial For Lutherans | 2.233 | -0,71 | 0 | |||||
| 2026-02-17 | 13F | Advisory Services Network, LLC | 40.125 | 1.709,06 | 5.208 | 1.707,99 | ||||
| 2026-01-14 | 13F/A | TABR Capital Management, LLC | 18.858 | 2.448 | ||||||
| 2026-04-07 | 13F | Cardinal Capital Management, Inc. | 1.004.527 | 1,62 | 135.631 | -23,02 | ||||
| 2026-02-04 | 13F | KLCM Advisors, Inc. | 3.779 | -9,20 | 490 | -9,59 | ||||
| 2026-04-20 | 13F | Ritholtz Wealth Management | 18.095 | 16,34 | 2.449 | 21,31 | ||||
| 2026-02-05 | 13F | Isthmus Partners, Llc | 3.091 | 401 | ||||||
| 2026-02-13 | 13F | Aviso Financial Inc. | 0 | -100,00 | 0 | |||||
| 2026-04-15 | 13F | Curbstone Financial Management Corp | 13.634 | -0,37 | 1.845 | 3,89 | ||||
| 2026-04-20 | 13F | Assenagon Asset Management S.A. | 21.852 | 0,54 | 2.950 | 4,39 | ||||
| 2026-04-15 | 13F | Addenda Capital Inc. | 674.068 | -7,07 | 127.008 | -1,77 | ||||
| 2026-04-16 | 13F | Toth Financial Advisory Corp | 500 | 25,00 | 68 | 31,37 | ||||
| 2026-04-15 | 13F | DAVENPORT & Co LLC | 19.068 | -22,85 | 2.581 | -19,55 | ||||
| 2026-04-22 | 13F | Apollon Wealth Management, LLC | 2.232 | 7,36 | 302 | 12,27 | ||||
| 2026-02-04 | 13F | Nwam Llc | 3.666 | -2,99 | 502 | 5,47 | ||||
| 2025-11-12 | 13F | Fox Run Management, L.l.c. | 0 | -100,00 | 0 | -100,00 | ||||
| 2026-02-10 | 13F | Bridges Investment Management Inc | 2.000 | 0,00 | 260 | -0,38 | ||||
| 2026-02-17 | 13F | Murchinson Ltd. | 13.347 | 1.732 | ||||||
| 2026-01-29 | 13F | Montrusco Bolton Investments Inc. | 208.443 | -8,23 | 27.106 | -8,44 | ||||
| 2026-01-28 | 13F | Geneos Wealth Management Inc. | 3.125 | 0,00 | 406 | -0,49 | ||||
| 2026-02-17 | 13F | XTX Topco Ltd | 30.479 | 35,02 | 3.956 | 34,52 | ||||
| 2026-01-30 | 13F | Caldwell Securities, Inc | 536 | -15,06 | 70 | -15,85 | ||||
| 2026-04-10 | 13F | Ipswich Investment Management Co., Inc. | 4.810 | -12,31 | 651 | -8,58 | ||||
| 2026-02-04 | 13F | Beverly Hills Private Wealth, LLC | 3.319 | 0,00 | 432 | 0,00 | ||||
| 2026-02-13 | 13F | Bay Colony Advisory Group, Inc d/b/a Bay Colony Advisors | 3.062 | 0,00 | 397 | -0,25 | ||||
| 2026-04-24 | 13F | UMA Financial Services, Inc. | 60 | 0,00 | 8 | 14,29 | ||||
| 2026-01-23 | 13F | Reuter James Wealth Management, Llc | 4.194 | -28,85 | 544 | -29,07 | ||||
| 2025-11-12 | 13F | Headlands Technologies LLC | 0 | -100,00 | 0 | -100,00 | ||||
| 2026-02-17 | 13F | Murchinson Ltd. | Call | 42.500 | 41,67 | 5.516 | 41,18 | |||
| 2025-11-07 | 13F | Midland Wealth Advisors Llc | 0 | -100,00 | 0 | |||||
| 2026-02-13 | 13F | Bridgewater Associates, LP | 4.759 | -7,93 | 619 | -8,17 | ||||
| 2026-02-17 | 13F | Murchinson Ltd. | Put | 42.500 | 41,67 | 5.516 | 41,18 | |||
| 2026-02-13 | 13F | National Bank Of Canada /fi/ | 11.003.421 | -2,21 | 1.428.139 | -2,40 | ||||
| 2026-02-13 | 13F | Cozad Asset Management Inc | 2.837 | 0,00 | 368 | -0,27 | ||||
| 2026-04-09 | 13F | Pacifica Partners Inc. | 5.005 | 677 | ||||||
| 2026-01-29 | 13F | Verdence Capital Advisors LLC | 7.417 | -13,18 | 963 | -11,50 | ||||
| 2025-11-14 | 13F | Wolverine Trading, Llc | Put | 60.900 | 7.905 | |||||
| 2026-02-17 | 13F | Wiley Bros.-aintree Capital, Llc | 13.249 | -14,52 | 1.720 | -14,82 | ||||
| 2026-04-17 | 13F | Hanson & Doremus Investment Management | 1.000 | 0 | ||||||
| 2026-02-05 | 13F | AlphaCore Capital LLC | 2.419 | 19,40 | 314 | 19,01 | ||||
| 2026-02-12 | 13F | Dimensional Fund Advisors Lp | 3.588.944 | 0,88 | 465.815 | 0,53 | ||||
| 2026-02-06 | 13F | Newport Trust Co | 1.315.207 | -0,51 | 170.701 | -0,86 | ||||
| 2026-02-11 | 13F | Metis Global Partners, LLC | 21.352 | -21,40 | 2.773 | -21,67 | ||||
| 2026-02-12 | 13F | Qtron Investments LLC | 0 | -100,00 | 0 | |||||
| 2026-02-17 | 13F | Financial Avengers, Inc. | 50 | 0,00 | 7 | 0,00 | ||||
| 2025-11-14 | 13F | Tcw Group Inc | 0 | -100,00 | 0 | |||||
| 2026-02-17 | 13F | SIG North Trading, ULC | Put | 2.214.400 | 4,52 | 287.407 | 4,15 | |||
| 2026-02-17 | 13F | Quantinno Capital Management LP | 47.435 | 35,60 | 6.157 | 35,12 | ||||
| 2026-02-17 | 13F | SIG North Trading, ULC | Call | 925.300 | 65,23 | 120.095 | 64,65 | |||
| 2026-02-13 | 13F | Parkside Financial Bank & Trust | 23 | 0,00 | 3 | 0,00 | ||||
| 2026-04-21 | 13F | Wedbush Securities Inc | 3.061 | -0,16 | 0 | |||||
| 2026-02-17 | 13F | SIG North Trading, ULC | 19.448 | 2.524 | ||||||
| 2025-11-14 | 13F | ICONIQ Capital, LLC | 0 | -100,00 | 0 | |||||
| 2025-11-14 | 13F | Wolverine Trading, Llc | 36.683 | 4.761 | ||||||
| 2025-11-14 | 13F | Wolverine Trading, Llc | Call | 32.100 | 4.167 | |||||
| 2026-02-13 | 13F | Ontario Teachers Pension Plan Board | 0 | -100,00 | 0 | |||||
| 2025-11-12 | 13F | 111 Capital | 0 | -100,00 | 0 | |||||
| 2026-01-20 | 13F | Cromwell Holdings LLC | 1.739 | 0,00 | 226 | -0,44 | ||||
| 2026-01-21 | 13F | Landaas & Co /wi /adv | 1.918 | -0,98 | 249 | -1,59 | ||||
| 2026-02-06 | 13F | Harvest Portfolios Group Inc. | 36.879 | 12,04 | 4.789 | 11,66 | ||||
| 2026-04-21 | 13F | OneAscent Family Office, LLC | 1.615 | -3,41 | 219 | 0,46 | ||||
| 2026-02-13 | 13F | Arkadios Wealth Advisors | 1.681 | -0,94 | 218 | -1,36 | ||||
| 2026-04-23 | 13F | MQS Management LLC | 0 | -100,00 | 0 | |||||
| 2026-01-21 | 13F | Albion Financial Group /ut | 0 | -100,00 | 0 | |||||
| 2026-01-27 | 13F | Brighton Jones Llc | 0 | -100,00 | 0 | |||||
| 2026-02-05 | 13F | Bessemer Group Inc | 40.491 | -11,14 | 5 | 0,00 | ||||
| 2026-02-06 | 13F | GPS Wealth Strategies Group, LLC | 65 | 0,00 | 8 | 0,00 | ||||
| 2026-02-17 | 13F | Investment Management Corp of Ontario | 185.538 | 49,78 | 24.081 | 49,25 | ||||
| 2026-02-10 | 13F | Savant Capital, LLC | 5.590 | -1,55 | 726 | -1,89 | ||||
| 2026-02-17 | 13F | Tower Research Capital LLC (TRC) | 898 | -65,57 | 117 | -65,78 | ||||
| 2026-02-10 | 13F | Acadian Asset Management Llc | 1.201.968 | -59,82 | 156 | -59,90 | ||||
| 2026-02-17 | 13F | Qube Research & Technologies Ltd | 350.787 | 313,01 | 45.534 | 311,55 | ||||
| 2026-04-13 | 13F | Trust Co | 193 | 0,00 | 26 | 4,00 | ||||
| 2026-02-13 | 13F | Cornerstone Financial Management LLC | 16 | 2 | ||||||
| 2026-02-03 | 13F | McIlrath & Eck, LLC | 55 | 0,00 | 7 | 0,00 | ||||
| 2026-02-12 | 13F | Johnson Financial Group, Inc. | 1.006 | 0,00 | 131 | -0,76 | ||||
| 2026-02-10 | 13F | Bruce G. Allen Investments, LLC | 178 | 0,00 | 23 | 0,00 | ||||
| 2025-10-30 | 13F | Ridgewood Investments LLC | 0 | -100,00 | 0 | |||||
| 2026-04-21 | 13F | Value Partners Investments Inc. | 440.552 | -5,33 | 59.551 | -1,60 | ||||
| 2026-02-18 | 13F | Vident Advisory, LLC | 3.724 | 25,60 | 484 | 25,13 | ||||
| 2026-01-27 | 13F | Lorne Steinberg Wealth Management Inc. | 98.630 | 1,29 | 12.827 | 1,11 | ||||
| 2026-02-17 | 13F | Magnetar Financial LLC | 29.585 | 3.840 | ||||||
| 2026-04-07 | 13F | Park Avenue Securities Llc | 4.156 | -14,71 | 1 | |||||
| 2026-04-10 | 13F/A | PBU - The Pension Fund of Early Childhood & Youth Educators | 152.951 | 49,72 | 20.651 | 55,45 | ||||
| 2026-02-10 | 13F | Monaco Asset Management SAM | Put | 75.000 | 0,00 | 9.734 | -0,35 | |||
| 2026-02-19 | 13F | Birchwood Financial Partners, Inc. | 467 | 61 | ||||||
| 2026-04-13 | 13F | True Wealth Design, LLC | 297 | 38,14 | 40 | 48,15 | ||||
| 2026-02-06 | 13F | Ironwood Investment Counsel, LLC | 1.605 | -4,75 | 208 | -5,02 | ||||
| 2026-02-13 | 13F | Atlas Capital Advisors Llc | 3.644 | 5,17 | 473 | 23,24 | ||||
| 2026-02-11 | 13F | Allianz Asset Management GmbH | 45.340 | 6,97 | 5.896 | 6,79 | ||||
| 2026-02-11 | 13F | Tradition Wealth Management, LLC | 5.474 | -0,09 | 710 | -0,42 | ||||
| 2025-11-13 | 13F | Glenmede Investment Management, LP | 5.043 | -0,90 | 657 | 16,73 | ||||
| 2026-04-13 | 13F | St Germain D J Co Inc | 31.288 | -9,54 | 4.235 | -5,68 | ||||
| 2026-02-17 | 13F | Parallax Volatility Advisers, L.P. | Call | 0 | -100,00 | 0 | ||||
| 2026-01-28 | 13F | VAUGHAN & Co SECURITIES, INC. | 5.411 | -2,33 | 702 | -2,64 | ||||
| 2026-02-05 | 13F | Passumpsic Savings Bank | 5.314 | 3,08 | 690 | 37,80 | ||||
| 2026-02-17 | 13F | Public Employees Retirement System Of Ohio | 73.683 | -44,10 | 9.581 | -44,18 | ||||
| 2026-02-12 | 13F | Steward Partners Investment Advisory, Llc | 5.344 | -17,07 | 694 | -17,40 | ||||
| 2026-02-17 | 13F | Westwood Holdings Group Inc | 2.336 | 0,00 | 303 | -0,33 | ||||
| 2026-02-12 | 13F | APG Asset Management N.V. | 368.969 | -9,85 | 40.853 | -10,02 | ||||
| 2026-02-17 | 13F | Russell Investments Group, Ltd. | 318.561 | -13,99 | 41.439 | -14,08 | ||||
| 2026-02-02 | 13F | Varma Mutual Pension Insurance Co | 143.329 | -3,89 | 18.638 | -4,11 | ||||
| 2026-01-23 | 13F | Rsm Us Wealth Management Llc | 1.794 | -34,41 | 234 | -34,27 | ||||
| 2026-01-30 | 13F | Us Bancorp \de\ | 24.860 | 9,80 | 3.227 | 9,39 | ||||
| 2026-04-17 | 13F | Stephenson National Bank & Trust | 25 | 0,00 | 3 | 0,00 | ||||
| 2026-02-02 | 13F | Cornerstone Planning Group LLC | 109 | 17,20 | 15 | 36,36 | ||||
| 2026-01-23 | 13F | Ti-trust, Inc | 6.692 | 0,00 | 869 | -0,34 | ||||
| 2026-02-10 | 13F | Natixis Advisors, L.p. | 72.166 | 9,65 | 9 | 12,50 | ||||
| 2026-02-13 | 13F | Manufacturers Life Insurance Company, The | 0 | -100,00 | 0 | |||||
| 2025-11-13 | 13F | Guggenheim Capital Llc | 0 | -100,00 | 0 | -100,00 | ||||
| 2026-02-17 | 13F | Algert Global Llc | 0 | -100,00 | 0 | |||||
| 2026-02-17 | 13F | Capital Fund Management S.a. | 87.423 | -4,79 | 11.347 | -5,13 | ||||
| 2026-02-13 | 13F | Pinney & Scofield, Inc. | 1.700 | 0,00 | 221 | -0,45 | ||||
| 2026-02-17 | 13F | SageView Advisory Group, LLC | 186 | 24 | ||||||
| 2026-04-17 | 13F | Murphy & Mullick Capital Management Corp | 2.732 | -1,83 | 370 | 2,22 | ||||
| 2026-04-14 | 13F | Plancorp, LLC | 1.996 | 0,05 | 288 | 11,63 | ||||
| 2026-02-05 | 13F | Allworth Financial LP | 2.281 | 7,54 | 296 | 7,25 | ||||
| 2026-02-11 | 13F | Tiaa Trust, National Association | 5.655 | 0,00 | 734 | -0,41 | ||||
| 2026-01-26 | 13F | Private Trust Co Na | 904 | -17,37 | 117 | -17,61 | ||||
| 2026-04-13 | 13F | IFP Advisors, Inc | 266 | -2,21 | 36 | 2,86 | ||||
| 2026-02-03 | 13F/A | Bank Of America Corp /de/ | Call | 0 | -100,00 | 0 | -100,00 | |||
| 2026-02-02 | 13F | Principal Financial Group Inc | 13.700 | -6,16 | 1.782 | -6,36 | ||||
| 2026-02-13 | 13F | Van Eck Associates Corp | 619.368 | 29,37 | 80 | 29,03 | ||||
| 2026-04-15 | 13F | Merit Financial Group, LLC | 6.447 | 10,85 | 873 | 15,65 | ||||
| 2026-04-15 | 13F | Journey Strategic Wealth Llc | 8.545 | -0,95 | 1.156 | 3,31 | ||||
| 2026-02-17 | 13F | Bank Of America Corp /de/ | 2.402.278 | -23,22 | 311.792 | -23,49 | ||||
| 2026-02-20 | 13F | Sunbelt Securities, Inc. | 323 | 0,00 | 42 | -2,38 | ||||
| 2026-04-17 | 13F | Ignite Planners, LLC | 4.941 | -3,29 | 667 | -4,03 | ||||
| 2026-02-13 | 13F | Colony Group, LLC | 12.552 | 28,87 | 1.629 | 39,23 | ||||
| 2026-01-21 | 13F | Westfuller Advisors, LLC | 14 | 0,00 | 2 | 0,00 | ||||
| 2026-04-15 | 13F | Avanza Fonder AB | 46.542 | 2,11 | 8.769 | 7,94 | ||||
| 2026-04-15 | 13F | Valley National Advisers Inc | 26 | 0,00 | 0 | |||||
| 2025-10-30 | 13F | Twin Peaks Wealth Advisors, LLC | 0 | -100,00 | 0 | |||||
| 2026-03-26 | 13F/A | Peak6 Llc | 0 | -100,00 | 0 | -100,00 | ||||
| 2025-11-14 | 13F | Verition Fund Management LLC | 0 | -100,00 | 0 | -100,00 | ||||
| 2026-02-19 | 13F | Atomi Financial Group, Inc. | 8.555 | 6,67 | 1.110 | 6,32 | ||||
| 2025-11-10 | 13F | Tableaux Llc | 0 | -100,00 | 0 | -100,00 | ||||
| 2026-04-10 | 13F | Pure Financial Advisors, Inc. | 2.523 | 31,13 | 341 | 36,95 | ||||
| 2026-02-12 | 13F | Federation des caisses Desjardins du Quebec | 3.377.840 | -1,46 | 438.799 | -1,30 | ||||
| 2026-04-10 | 13F | Perfromance Wealth Partners, LLC | 2.500 | 0,00 | 338 | 4,32 | ||||
| 2026-02-09 | 13F | MSH Capital Advisors LLC | 1.925 | 0,00 | 250 | -0,40 | ||||
| 2026-02-11 | 13F | CenterBook Partners LP | 14.048 | 1.823 | ||||||
| 2026-02-13 | 13F | Alberta Investment Management Corp | 1.000.300 | 129.909 | ||||||
| 2026-04-06 | 13F | Highline Wealth Partners Llc | 65 | 41,30 | 9 | 60,00 | ||||
| 2026-02-17 | 13F | Laird Norton Trust Company, Llc | 19.245 | 2.498 | ||||||
| 2026-02-11 | 13F | SOUTH STATE Corp | 0 | -100,00 | 0 | |||||
| 2026-02-14 | 13F | Rockefeller Capital Management L.P. | 13.908 | 117,41 | 1.805 | 116,69 | ||||
| 2026-02-09 | 13F | Hantz Financial Services, Inc. | 12 | 0,00 | 0 | |||||
| 2025-10-28 | 13F | BRYN MAWR TRUST Co | 732 | -3,43 | 95 | 14,46 | ||||
| 2026-04-09 | 13F | Park Place Capital Corp | 1.482 | -29,53 | 201 | -26,47 | ||||
| 2026-01-27 | 13F | Busey Wealth Management | 6.249 | 3,70 | 811 | 3,44 | ||||
| 2026-04-14 | 13F | Tradewinds Capital Management, LLC | 125 | 0,00 | 17 | 0,00 | ||||
| 2026-04-07 | 13F | Boltwood Capital Management | 4.375 | 0,00 | 592 | 4,41 | ||||
| 2026-02-10 | 13F | Measured Wealth Private Client Group, LLC | 1.829 | 237 | ||||||
| 2026-02-13 | 13F | Natixis | 40.128 | 11,36 | 5.208 | 10,97 | ||||
| 2026-04-20 | 13F | MBM Wealth Consultants, LLC | 87 | 12 | ||||||
| 2026-02-03 | 13F | K.J. Harrison & Partners Inc | 49.606 | -2,44 | 6.451 | -2,58 | ||||
| 2025-11-14 | 13F | PineBridge Investments, L.P. | 1.597 | -77,26 | 290 | -72,71 | ||||
| 2026-02-17 | 13F | Aqr Capital Management Llc | 275.988 | 500,39 | 35.839 | 498,60 | ||||
| 2026-02-17 | 13F | Tudor Investment Corp Et Al | Call | 18.400 | -31,85 | 2.388 | -32,08 | |||
| 2026-04-24 | 13F | Vision Financial Markets Llc | 400 | 0,00 | 54 | 5,88 | ||||
| 2026-02-12 | 13F | Jane Street Group, Llc | 201.553 | 47,29 | 26.160 | 46,77 | ||||
| 2026-02-17 | 13F | Tudor Investment Corp Et Al | Put | 13.800 | -13,75 | 1.791 | -14,06 | |||
| 2026-02-03 | 13F | Vantage Financial Partners, LLC | 3.465 | 0,12 | 450 | -0,22 | ||||
| 2026-01-15 | 13F | Mn Services Vermogensbeheer B.V. | 165.213 | 16,27 | 21 | 16,67 | ||||
| 2025-11-12 | 13F | NewSquare Capital LLC | 0 | -100,00 | 0 | |||||
| 2025-11-12 | 13F | CIBC Bancorp USA Inc. | 10.856 | 1.462 | ||||||
| 2026-02-12 | 13F | Jane Street Group, Llc | Put | 102.500 | 52,08 | 13.303 | 51,55 | |||
| 2026-01-27 | 13F | TD Waterhouse Canada Inc. | 2.316.589 | -2,54 | 300.775 | -2,44 | ||||
| 2026-02-11 | 13F | LPL Financial LLC | 339.198 | -14,67 | 44.025 | -14,97 | ||||
| 2026-02-12 | 13F | Jane Street Group, Llc | Call | 38.700 | -16,05 | 5.023 | -16,36 | |||
| 2026-02-12 | 13F | JPL Wealth Management, LLC | 0 | -100,00 | 0 | |||||
| 2026-02-11 | 13F | Jpmorgan Chase & Co | 3.297.431 | -18,26 | 427.974 | -18,55 | ||||
| 2026-02-12 | 13F | Scotia Capital Inc. | 3.577.883 | 0,17 | 464.503 | 0,39 | ||||
| 2026-02-13 | 13F | Clarkston Capital Partners, LLC | 1.775 | 0,00 | 230 | -0,43 | ||||
| 2026-02-17 | 13F | Millennium Management Llc | Call | 0 | -100,00 | 0 | ||||
| 2026-02-17 | 13F | Utah Retirement Systems | 80.732 | 0,00 | 10.498 | -0,23 | ||||
| 2026-02-17 | 13F | Blair William & Co/il | 7.343 | -8,05 | 953 | -8,37 | ||||
| 2026-04-24 | 13F | ERn Financial, LLC | 1.680 | 0,00 | 227 | 4,13 | ||||
| 2026-02-06 | 13F | Global Retirement Partners, LLC | 1.923 | 28,03 | 250 | 27,69 | ||||
| 2026-02-03 | 13F | Sequoia Financial Advisors, LLC | 5.923 | 4,46 | 769 | 4,07 | ||||
| 2026-01-28 | 13F | N.E.W. Advisory Services LLC | 716 | 29,95 | 93 | 29,58 | ||||
| 2026-02-13 | 13F | Wells Fargo & Company/mn | 365.849 | -22,14 | 47.541 | -22,28 | ||||
| 2026-04-24 | 13F | USS Investment Management Ltd | 110.275 | 1,03 | 14.898 | 5,03 | ||||
| 2026-02-12 | 13F | Colonial Trust Advisors | 40 | 0,00 | 5 | 0,00 | ||||
| 2026-02-11 | 13F | Group One Trading, L.p. | 5.866 | 104,32 | 761 | 104,02 | ||||
| 2026-01-23 | 13F | Sunpointe, LLC | 0 | -100,00 | 0 | |||||
| 2026-02-12 | 13F | Wealthspire Advisors, LLC | 6.835 | 9,71 | 887 | 9,37 | ||||
| 2026-04-16 | 13F | Park National Corp /oh/ | 2.325 | 0,00 | 315 | 4,32 | ||||
| 2026-04-08 | 13F | Grove Bank & Trust | 710 | 0,00 | 96 | 4,35 | ||||
| 2026-02-13 | 13F | Northwest Bancshares, Inc. | 42.835 | -16,63 | 5.560 | -16,93 | ||||
| 2026-02-10 | 13F | Hillsdale Investment Management Inc. | 478.120 | -8,93 | 62.203 | -9,06 | ||||
| 2026-04-08 | 13F | Olistico Wealth, LLC | 700 | 0,00 | 95 | 4,44 | ||||
| 2026-02-11 | 13F | Twin Tree Management, LP | Call | 134.600 | -11,27 | 17.470 | -11,59 | |||
| 2026-02-11 | 13F | Twin Tree Management, LP | Put | 14.800 | 0,00 | 1.921 | -0,36 | |||
| 2026-02-12 | 13F | Campbell & CO Investment Adviser LLC | 28.871 | 761,31 | 3.747 | 759,40 | ||||
| 2026-02-17 | 13F | FIL Ltd | 9.445.162 | 15,19 | 1.226.622 | 14,80 | ||||
| 2026-01-30 | 13F | WoodTrust Financial Corp | 2.189 | -21,51 | 0 | |||||
| 2026-01-28 | 13F | DekaBank Deutsche Girozentrale | 144.747 | 0,00 | 14 | -22,22 | ||||
| 2026-02-13 | 13F | Caitong International Asset Management Co., Ltd | 0 | -100,00 | 0 | |||||
| 2026-02-04 | 13F | Madison Asset Management, LLC | 1.702 | 0,00 | 221 | -0,45 | ||||
| 2026-02-10 | 13F | Nomura Asset Management Co Ltd | 0 | 0 | ||||||
| 2026-02-12 | 13F | Great Valley Advisor Group, Inc. | 5.583 | -0,02 | 725 | -0,41 | ||||
| 2026-02-17 | 13F | Bayesian Capital Management, LP | 0 | -100,00 | 0 | |||||
| 2026-01-21 | 13F | Signature Resources Capital Management, LLC | 71 | 0,00 | 9 | 0,00 | ||||
| 2026-02-13 | 13F | Ossiam | 6.476 | -53,23 | 842 | -53,33 | ||||
| 2026-01-16 | 13F | Crewe Advisors LLC | 400 | 0,00 | 52 | -1,92 | ||||
| 2026-01-26 | 13F | Townsend & Associates, Inc | 2.225 | 0,00 | 300 | 8,30 | ||||
| 2026-02-13 | 13F | First Trust Advisors Lp | 288.183 | -4,07 | 37.404 | -4,40 | ||||
| 2025-11-20 | 13F | First Affirmative Financial Network | 1.981 | 1,28 | 258 | 19,44 | ||||
| 2026-02-09 | 13F | Smithfield Trust Co | 9.766 | 0,00 | 1 | 0,00 | ||||
| 2026-02-13 | 13F | Beutel, Goodman & Co Ltd. | 4.990.717 | -7,37 | 649 | -7,69 | ||||
| 2026-04-13 | 13F | Nvest Wealth Strategies, Inc. | 2 | 0 | ||||||
| 2026-02-17 | 13F | Wellington Management Group Llp | 80.729 | -17,90 | 10.498 | -18,09 | ||||
| 2026-02-13 | 13F | Evelyn Partners Investment Management Services Ltd | 500 | 0,00 | 65 | -1,54 | ||||
| 2026-02-03 | 13F | Ethic Inc. | 6.317 | 46,53 | 820 | 45,99 | ||||
| 2026-02-11 | 13F | Letko, Brosseau & Associates Inc | 1.674.225 | -5,67 | 217.713 | -5,89 | ||||
| 2026-01-28 | 13F | Davis-rea Ltd. | 3.800 | -5,07 | 494 | -5,37 | ||||
| 2026-04-06 | 13F | Versant Capital Management, Inc | 4.163 | 26,69 | 563 | 32,16 | ||||
| 2026-04-22 | 13F | Canoe Financial LP | 1.442 | 195 | ||||||
| 2026-02-13 | 13F | Morgan Stanley | 3.817.406 | 74,38 | 495.461 | 73,77 | ||||
| 2026-02-11 | 13F | Cerity Partners LLC | 18.079 | 27,00 | 2.346 | 26,61 | ||||
| 2026-02-04 | 13F | Ameritas Advisory Services, LLC | 1.801 | -21,66 | 234 | -22,07 | ||||
| 2025-10-28 | 13F | Pinnacle Financial Partners Inc | 109.482 | 0,09 | 14.260 | 17,84 | ||||
| 2026-01-15 | 13F | Jamison Private Wealth Management, Inc. | 3.558 | 0,00 | 462 | -0,43 | ||||
| 2026-02-13 | 13F | Umb Bank N A/mo | 2.976 | -35,22 | 386 | -35,45 | ||||
| 2026-04-15 | 13F | Redhawk Wealth Advisors, Inc. | 10.458 | 29,43 | 1.415 | 35,02 | ||||
| 2026-01-28 | 13F | Financial Perspectives, Inc | 48 | 0,00 | 6 | 0,00 | ||||
| 2026-04-22 | 13F | Gold Investment Management Ltd. | 23.088 | 0,83 | 3.124 | 5,08 | ||||
| 2025-10-30 | 13F | WFA Asset Management Corp | 181 | 0,00 | 16 | 6,67 | ||||
| 2026-02-17 | 13F | Ewing Morris & Co. Investment Partners Ltd. | 26.588 | -1,45 | 3.500 | -0,48 | ||||
| 2026-04-15 | 13F | Code Waechter LLC | 3.582 | -20,15 | 485 | -16,84 | ||||
| 2026-02-05 | 13F | Cambridge Investment Research Advisors, Inc. | 10.530 | 0,98 | 1 | 0,00 | ||||
| 2026-04-15 | 13F | Silverlake Wealth Management Llc | 4.020 | 0,15 | 544 | 4,42 | ||||
| 2026-02-06 | 13F | Larson Financial Group LLC | 317 | 33,19 | 41 | 32,26 | ||||
| 2026-02-02 | 13F | Danske Bank A/s | 2.977 | -10,25 | 387 | -9,37 | ||||
| 2026-04-14 | 13F | Prospera Financial Services Inc | 3.438 | 0,00 | 465 | 4,26 | ||||
| 2026-01-26 | 13F | Cwm, Llc | 4.150 | 1,47 | 1 | |||||
| 2026-02-13 | 13F | State Street Corp | 11.465 | 0,00 | 1.488 | -0,33 | ||||
| 2026-02-17 | 13F | Quadrature Capital Ltd | 507.782 | 66.025 | ||||||
| 2026-02-10 | 13F | David R. Rahn & Associates Inc. | 3.425 | 0,00 | 445 | -0,45 | ||||
| 2026-04-20 | 13F | First American Bank | 9.360 | 0,00 | 1.267 | 4,28 | ||||
| 2026-02-18 | 13F | Guardian Capital Lp | 680.733 | -60,36 | 88.447 | -60,48 | ||||
| 2026-02-05 | 13F | Stephens Inc /ar/ | 2.196 | -23,43 | 285 | -23,59 | ||||
| 2026-02-04 | 13F | Valeo Financial Advisors, LLC | 2.162 | 0,00 | 281 | -0,36 | ||||
| 2026-02-12 | 13F | Federated Hermes, Inc. | 865.639 | -27,20 | 112.351 | -27,46 | ||||
| 2026-02-17 | 13F | Two Sigma Securities, Llc | 2.154 | 280 | ||||||
| 2026-02-17 | 13F | Susquehanna Fundamental Investments, Llc | 18.800 | 2.440 | ||||||
| 2026-02-10 | 13F | Gulf International Bank (UK) Ltd | 36.241 | 0,00 | 5 | -33,33 | ||||
| 2025-10-31 | 13F | Whittier Trust Co | 0 | -100,00 | 0 | |||||
| 2026-04-08 | 13F | Legacy Wealth Asset Management, LLC | 5.002 | 677 | ||||||
| 2026-02-17 | 13F | Jones Financial Companies Lllp | 13.039 | 20,22 | 1.692 | 19,49 | ||||
| 2026-02-19 | 13F | CI Private Wealth, LLC | 24.071 | -0,24 | 3.129 | -0,48 | ||||
| 2026-02-13 | 13F | Public Sector Pension Investment Board | 391.429 | 7,57 | 50.835 | 7,19 | ||||
| 2026-04-21 | 13F | Mesirow Financial Investment Management, Inc. | 2.410 | 13,63 | 326 | 18,55 | ||||
| 2026-02-10 | 13F | Scheer, Rowlett & Associates Investment Management Ltd. | 464.627 | -21,82 | 60.341 | -22,07 | ||||
| 2026-02-13 | 13F | Squarepoint Ops LLC | 17.356 | 2.253 | ||||||
| 2026-02-13 | 13F | BRITISH COLUMBIA INVESTMENT MANAGEMENT Corp | 935.883 | 50,67 | 121.544 | 50,19 | ||||
| 2026-02-13 | 13F | BNP Paribas Asset Management Holding S.A. | 110.065 | 20 | ||||||
| 2026-01-29 | 13F | Vanguard Group Inc | 33.017.205 | 2,08 | 4.287.878 | 1,74 | ||||
| 2026-04-21 | 13F | GHP Investment Advisors, Inc. | 79 | 0,00 | 11 | 0,00 | ||||
| 2026-04-23 | 13F | Lansforsakringar Fondforvaltning AB (publ) | 166.129 | 0,69 | 22.430 | 4,54 | ||||
| 2026-02-10 | 13F | Goldman Sachs Group Inc | 1.863.281 | -45,91 | 241.835 | -46,10 | ||||
| 2026-02-17 | 13F | Nearwater Capital Markets, Ltd | 0 | -100,00 | 0 | |||||
| 2025-11-13 | 13F | Capital World Investors | 0 | -100,00 | 0 | |||||
| 2026-02-10 | 13F | Goldman Sachs Group Inc | Call | 88.000 | 0,00 | 11.422 | -0,36 | |||
| 2026-02-12 | 13F | Advisors Asset Management, Inc. | 6.413 | -25,34 | 832 | -25,58 | ||||
| 2026-02-10 | 13F | Goldman Sachs Group Inc | Put | 88.000 | 0,00 | 11.422 | -0,36 | |||
| 2026-02-10 | 13F | Forsta Ap-fonden | 180.600 | -15,84 | 23.485 | -16,04 | ||||
| 2026-02-05 | 13F | Hills Bank & Trust Co | 1.000 | 0,00 | 130 | -0,77 | ||||
| 2026-02-04 | 13F | Income Insurance Ltd | 2.132 | 277 | ||||||
| 2026-02-13 | 13F | Carter Financial Group, INC. | 0 | -100,00 | 0 | |||||
| 2026-02-13 | 13F | Ausdal Financial Partners, Inc. | 8.308 | 1,23 | 1.078 | 0,84 | ||||
| 2026-02-10 | 13F | Beto Financial Group, Llc | 1.514 | 210 | ||||||
| 2026-02-23 | 13F | Mv Capital Management, Inc. | 7 | 1 | ||||||
| 2026-02-03 | 13F | SBI Securities Co., Ltd. | 2.549 | -2,30 | 331 | -2,65 | ||||
| 2026-02-18 | 13F | Beacon Pointe Advisors, LLC | 52.635 | 0,42 | 6.831 | 0,06 | ||||
| 2025-11-04 | 13F | Pineridge Advisors LLC | 6 | 0,00 | 1 | |||||
| 2026-02-10 | 13F | Crescent Grove Advisors, LLC | 3.839 | 0,00 | 498 | -0,40 | ||||
| 2026-02-17 | 13F | Capital Fund Management S.a. | Call | 15.900 | 1,92 | 2.064 | 1,58 | |||
| 2026-02-12 | 13F | Hrt Financial Lp | 6.731 | 26,50 | 1 | |||||
| 2026-02-10 | 13F | PCJ Investment Counsel Ltd. | 41.850 | -12,02 | 5.435 | -12,30 | ||||
| 2026-02-17 | 13F | Point72 Asset Management, L.P. | 15.996 | 2.081 | ||||||
| 2025-11-14 | 13F | AXA Investment Managers S.A. | 147.667 | 19.234 | ||||||
| 2026-02-13 | 13F | Baird Financial Group, Inc. | 37.639 | -1,33 | 4.885 | -1,67 | ||||
| 2026-02-17 | 13F | Capital Fund Management S.a. | Put | 10.200 | 1.324 | |||||
| 2026-02-04 | 13F | Pensionmark Financial Group, Llc | 4.835 | -2,68 | 600 | -7,42 | ||||
| 2026-02-12 | 13F | Burkett Asset Management Ltd | 23.700 | 3.082 | ||||||
| 2026-02-17 | 13F | Royal Bank Of Canada | Put | 5.720.000 | 13,49 | 742.399 | 13,09 | |||
| 2026-02-11 | 13F | West Family Investments, Inc. | 3.854 | 0,00 | 500 | -0,20 | ||||
| 2026-02-04 | 13F | Kepler Cheuvreux (Suisse) SA | 34.266 | 6.108 | ||||||
| 2026-02-17 | 13F | Royal Bank Of Canada | Call | 533.700 | -86,82 | 69.269 | -86,87 | |||
| 2026-02-13 | 13F | Commerce Bank | 2.802 | 0,00 | 364 | -0,27 | ||||
| 2026-02-13 | 13F | American Century Companies Inc | 280.923 | 15,31 | 36.483 | 14,92 | ||||
| 2026-02-12 | 13F | Colonial Trust Co / SC | 10 | -33,33 | 1 | 0,00 | ||||
| 2026-01-15 | 13F | Frank, Rimerman Advisors LLC | 6.664 | 52,88 | 865 | 52,38 | ||||
| 2026-02-17 | 13F | Northern Trust Corp | 546.110 | 0,43 | 70.880 | 0,08 | ||||
| 2026-02-17 | 13F | Two Sigma Advisers, Lp | 53.898 | 3.070,47 | 6.995 | 3.065,16 | ||||
| 2026-04-22 | 13F | Atlantic Edge Private Wealth Management, LLC | 50 | 7 | ||||||
| 2026-02-17 | 13F | Credit Agricole S A | 13.064 | 26,93 | 1.696 | 26,49 | ||||
| 2026-02-17 | 13F | Scientech Research LLC | 1.739 | 226 | ||||||
| 2026-04-13 | 13F | Fiduciary Financial Group, Llc | 1.823 | 12,32 | 247 | 17,14 | ||||
| 2026-02-13 | 13F | 1832 Asset Management L.P. | 10.417.243 | 64,40 | 1.352.054 | 63,82 | ||||
| 2026-02-04 | 13F | Independent Advisor Alliance | 9.873 | 7,95 | 1.281 | 7,56 | ||||
| 2026-02-10 | 13F | CIBC Asset Management Inc | 6.237.739 | -14,08 | 814.500 | -14,21 | ||||
| 2026-01-23 | 13F | Carnegie Capital Asset Management, LLC | 23.993 | -0,31 | 3.114 | -0,64 | ||||
| 2026-04-22 | 13F | Louisbourg Investments Inc. | 8.400 | 0,00 | 1.135 | 3,94 | ||||
| 2026-02-13 | 13F | Fairman Group, LLC | 0 | -100,00 | 0 | |||||
| 2026-04-21 | 13F | PDS Planning, Inc | 4.251 | -3,36 | 575 | 0,88 | ||||
| 2026-01-20 | 13F | Cigna Investments Inc /new | 12.746 | -1,57 | 2 | 0,00 | ||||
| 2026-01-22 | 13F | Bear Mountain Capital, Inc. | 0 | -100,00 | 0 | |||||
| 2026-02-13 | 13F | Corient IA LLC | 0 | -100,00 | 0 | |||||
| 2026-02-13 | 13F | Kestra Advisory Services, LLC | 0 | -100,00 | 0 | |||||
| 2026-04-13 | 13F | Affinity Capital Advisors, LLC | 1.710 | 5,62 | 231 | 10,00 | ||||
| 2026-01-23 | 13F | Bridgewater Advisors Inc. | 2.869 | 0,00 | 390 | 10,51 | ||||
| 2026-02-06 | 13F | Leonteq Securities AG | 5 | 0,00 | 1 | |||||
| 2026-02-17 | 13F | WFA of San Diego, LLC | 0 | -100,00 | 0 | |||||
| 2025-11-07 | 13F | Sierra Ocean, Llc | 0 | -100,00 | 0 | |||||
| 2026-04-15 | 13F | Bayforest Capital Ltd | 1.010 | 185,31 | 137 | 202,22 | ||||
| 2026-04-24 | 13F | Medallion Wealth Advisors, LLC | 2.554 | -5,37 | 346 | -1,43 | ||||
| 2026-04-16 | 13F | Annex Advisory Services, LLC | 3.925 | 5,97 | 531 | 10,63 | ||||
| 2026-04-24 | 13F | Keybank National Association/oh | 11.755 | 26,44 | 1.591 | 31,84 | ||||
| 2026-02-17 | 13F | Toronto Dominion Bank | 6.503.168 | 6,59 | 844.587 | 6,28 | ||||
| 2026-02-17 | 13F | Toronto Dominion Bank | Put | 882.100 | -4,97 | 114.559 | -5,27 | |||
| 2026-02-17 | 13F | Toronto Dominion Bank | Call | 932.800 | -13,52 | 121.143 | -13,79 | |||
| 2026-02-06 | 13F | Pathway Financial Advisers, LLC | 0 | -100,00 | 0 | |||||
| 2026-02-06 | 13F | Addison Advisors LLC | 132 | -26,67 | 17 | -26,09 | ||||
| 2026-04-13 | 13F | Baskin Financial Services Inc. | 4.967 | -29,72 | 1 | |||||
| 2026-04-23 | 13F | SJS Investment Consulting Inc. | 43 | 0,00 | 6 | 0,00 | ||||
| 2026-02-11 | 13F | Simplex Trading, Llc | 0 | -100,00 | 0 | |||||
| 2026-04-13 | 13F | Bank & Trust Co | 263 | 0,00 | 36 | 2,94 | ||||
| 2026-02-13 | 13F | Korea Investment CORP | 488.726 | 18,48 | 63.553 | 18,21 | ||||
| 2026-04-16 | 13F | Brookstone Capital Management | 1.672 | 0,00 | 226 | 4,63 | ||||
| 2025-11-07 | 13F | Cherokee Insurance Co | 0 | -100,00 | 0 | |||||
| 2026-02-06 | 13F/A | Rathbone Brothers plc | 41.384 | -0,05 | 5.382 | -0,28 | ||||
| 2026-02-13 | 13F | Police & Firemen's Retirement System of New Jersey | 96.551 | -7,87 | 12.555 | -8,08 | ||||
| 2026-02-17 | 13F | Hilltop Holdings Inc. | 2.297 | -27,90 | 298 | -28,02 | ||||
| 2026-04-01 | 13F | Rowland & Co Investment Counsel/adv | 0 | -100,00 | 0 | |||||
| 2026-02-17 | 13F | Canada Pension Plan Investment Board | 6.325.714 | 64,28 | 821.523 | 63,76 | ||||
| 2026-04-21 | 13F | Financial Consulate, Inc | 70 | 1.066,67 | 9 | |||||
| 2026-02-17 | 13F | BCV Asset Management Inc. | 654.737 | 127.677 | ||||||
| 2026-02-17 | 13F | Raymond James Financial Inc | 382.192 | -22,47 | 49.605 | -22,74 | ||||
| 2026-01-27 | 13F | Seeds Investor Llc | 1.644 | 0,49 | 213 | 0,00 | ||||
| 2026-02-10 | 13F | Fielder Capital Group LLC | 2.640 | 0,00 | 343 | -0,29 | ||||
| 2026-04-20 | 13F | Keudell/Morrison Wealth Management | 2.353 | -12,20 | 318 | -8,36 | ||||
| 2026-02-17 | 13F | Amundi | 1.289.261 | 33,01 | 169.249 | 32,52 | ||||
| 2026-04-13 | 13F | Gill Capital Partners, Llc | 2.412 | 0,00 | 326 | 4,15 | ||||
| 2026-04-15 | 13F | Rempart Asset Management Inc. | 191.899 | -7,59 | 25.910 | -3,98 | ||||
| 2026-02-18 | 13F | State of Tennessee, Treasury Department | 399.601 | -4,34 | 54.702 | 0,47 | ||||
| 2026-02-09 | 13F | Huntington National Bank | 517 | 0,00 | 67 | 0,00 | ||||
| 2026-01-30 | 13F/A | M&t Bank Corp | 57.622 | 0,76 | 7.478 | 0,39 | ||||
| 2026-04-22 | 13F | Caldwell Trust Co | 1.500 | 0,00 | 203 | 4,64 | ||||
| 2026-02-17 | 13F | Man Group plc | 204.396 | 384,82 | 26.570 | 383,71 | ||||
| 2026-04-17 | 13F | Cidel Asset Management Inc | 130.608 | 513,33 | 17.634 | 536,84 | ||||
| 2026-02-17 | 13F | Alphadyne Asset Management, LLC | Call | 4.200 | 0,00 | 545 | -0,37 | |||
| 2026-02-11 | 13F | Clearbridge Investments, LLC | 1.185.077 | -8,59 | 153.811 | -8,91 | ||||
| 2026-02-17 | 13F | Alphadyne Asset Management, LLC | Put | 7.700 | 862,50 | 999 | 860,58 | |||
| 2026-04-09 | 13F | Cliftonlarsonallen Wealth Advisors, Llc | 19.603 | 0,57 | 2.653 | 4,90 | ||||
| 2026-01-26 | 13F | PFG Investments, LLC | 1.688 | 0,54 | 219 | 0,46 | ||||
| 2025-11-13 | 13F | GeoWealth Management, LLC | 0 | -100,00 | 0 | |||||
| 2026-02-11 | 13F | Westerkirk Capital Inc. | 2.064 | -93,20 | 268 | -93,22 | ||||
| 2026-02-13 | 13F | PCM Encore, LLC | 3.707 | 481 | ||||||
| 2026-04-24 | 13F | Fulton Bank, N.a. | 7.299 | -27,74 | 988 | -24,71 | ||||
| 2026-02-09 | 13F | Morningstar Investment Management LLC | 9.571 | 1 | ||||||
| 2026-02-11 | 13F | Dorsey & Whitney Trust CO LLC | 6.081 | 0,03 | 789 | -0,25 | ||||
| 2026-04-08 | 13F | Wealth Enhancement Advisory Services, Llc | Put | 24.000 | 0,00 | 5.591 | 5.327,18 | |||
| 2026-04-08 | 13F | Wealth Enhancement Advisory Services, Llc | 40.435 | -34,31 | 0 | -100,00 | ||||
| 2026-04-22 | 13F | Harbor Asset Planning, Inc. | 352 | 0,00 | 48 | 4,44 | ||||
| 2026-02-02 | 13F | Benjamin Edwards Inc | 6.979 | -18,68 | 906 | -18,98 | ||||
| 2026-02-05 | 13F | 1620 Investment Advisors, Inc. | 254 | 0,00 | 33 | -3,03 | ||||
| 2026-02-13 | 13F | MAI Capital Management | 4.640 | 2,16 | 602 | 1,86 | ||||
| 2026-04-21 | 13F | Vise Technologies, Inc. | 17.151 | 0,00 | 2.226 | 0,00 | ||||
| 2026-02-04 | 13F | Swiss Life Asset Management Ltd | 110.795 | 10,93 | 14.387 | 10,40 | ||||
| 2026-02-11 | 13F | Commonwealth Retirement Investments LLC | 139 | 18 | ||||||
| 2026-02-13 | 13F | Kilter Group LLC | 25 | 3 | ||||||
| 2026-02-13 | 13F | Macquarie Group Ltd | 0 | -100,00 | 0 | -100,00 | ||||
| 2026-01-16 | 13F | Trust Co Of Vermont | 651 | -27,75 | 84 | -28,21 | ||||
| 2025-11-13 | 13F | Marshall Wace, Llp | 0 | -100,00 | 0 | -100,00 | ||||
| 2026-04-20 | 13F | Naples Global Advisors, Llc | 17.360 | -2,36 | 2.349 | 1,82 | ||||
| 2026-02-11 | 13F | Greykasell Wealth Strategies, Inc. | 1.521 | 0,00 | 197 | -0,51 | ||||
| 2026-02-17 | 13F | Balyasny Asset Management Llc | 0 | -100,00 | 0 | |||||
| 2026-02-11 | 13F | Tacita Capital Inc | 8.656 | 3,45 | 1.125 | 3,12 | ||||
| 2026-02-27 | 13F | Strategic Investment Solutions, Inc. /IL | 400 | 0,00 | 52 | -1,92 | ||||
| 2026-02-13 | 13F | Quarry LP | 28 | 4 | ||||||
| 2025-10-31 | 13F | International Assets Investment Management, Llc | 0 | -100,00 | 0 | |||||
| 2026-02-17 | 13F | Lazard Asset Management Llc | 2.855 | 50,50 | 371 | 49,80 | ||||
| 2026-04-22 | 13F | Union Bancaire Privee, UBP SA | 14.987 | 0,84 | 1.976 | 1,07 | ||||
| 2026-02-09 | 13F | Harbour Investments, Inc. | 6.932 | -4,78 | 900 | -5,17 | ||||
| 2026-02-05 | 13F | Dana Investment Advisors, Inc. | 50.565 | -0,88 | 6.563 | -1,23 | ||||
| 2026-01-29 | 13F | Aprio Wealth Management, LLC | 2.280 | 21,86 | 296 | 21,40 | ||||
| 2026-04-17 | 13F | Western Pacific Wealth Management, LP | 32 | 0,00 | 4 | 0,00 | ||||
| 2026-04-16 | 13F | Heck Capital Advisors, LLC | 0 | -100,00 | 0 | |||||
| 2026-02-13 | 13F | OpenArc Corporate Advisory, LLC | 116.031 | 15.060 | ||||||
| 2026-01-13 | 13F | Kathmere Capital Management, LLC | 2.005 | 7,45 | 260 | 7,00 | ||||
| 2026-02-13 | 13F | Rhumbline Advisers | 1.067 | -7,78 | 138 | -8,00 | ||||
| 2026-02-13 | 13F | Royal London Asset Management Ltd | 33.219 | 5,00 | 4.311 | 4,64 | ||||
| 2026-02-12 | 13F | Brinker Capital Investments, LLC | 14.646 | 28,38 | 1.901 | 27,95 | ||||
| 2026-01-22 | 13F | Massachusetts Financial Services Co /ma/ | 1.521.909 | -0,23 | 197.529 | -0,58 | ||||
| 2025-12-16 | 13F | Garde Capital, Inc. | 0 | -100,00 | 0 | |||||
| 2026-04-24 | 13F | Abacus Wealth Partners, LLC | 9.202 | 0,89 | 1.245 | 5,24 | ||||
| 2026-04-23 | 13F | Kerntke Otto McGlone Wealth Management Group | 1.523 | 206 | ||||||
| 2026-02-11 | 13F | MCF Advisors LLC | 110 | 0,00 | 14 | 0,00 | ||||
| 2026-04-24 | 13F | Private Advisor Group, LLC | 20.944 | 1,09 | 2.835 | 5,43 | ||||
| 2026-02-12 | 13F | Bank Of Nova Scotia Trust Co | 511.456 | 1,18 | 66.382 | 0,82 | ||||
| 2026-02-17 | 13F | RMB Capital Management, LLC | 4.848 | 0,19 | 629 | -0,16 | ||||
| 2026-02-06 | 13F | Envestnet Portfolio Solutions, Inc. | 13.730 | -21,08 | 1.782 | -21,36 | ||||
| 2026-02-13 | 13F | Great West Life Assurance Co /can/ | 356.827 | -19,00 | 46 | -19,30 | ||||
| 2026-02-13 | 13F | Entropy Technologies, LP | 11.550 | 1.499 | ||||||
| 2026-02-17 | 13F | Ameriprise Financial Inc | 44.685 | 4,99 | 6.571 | 4,95 | ||||
| 2026-02-10 | 13F/A | Northwestern Mutual Wealth Management Co | 21.268 | 35,46 | 2.760 | 35,03 | ||||
| 2026-01-28 | 13F | Harbour Trust & Investment Management Co | 5.955 | -0,33 | 773 | -0,77 | ||||
| 2026-04-23 | 13F | Ellenbecker Investment Group | 4.505 | 0,00 | 610 | 4,28 | ||||
| 2026-04-09 | 13F | Tompkins Financial Corp | 1.000 | 0,00 | 135 | 4,65 | ||||
| 2026-04-20 | 13F | Kestra Private Wealth Services, Llc | 4.390 | -0,39 | 594 | 4,03 | ||||
| 2026-04-24 | 13F | Trust Investment Advisors | 1.589 | 0,63 | 215 | 5,39 | ||||
| 2026-02-09 | 13F | Cary Street Partners Financial Llc | 3.700 | 0,00 | 480 | -0,21 | ||||
| 2026-01-21 | 13F | Quilter Plc | 3.710 | 0,00 | 482 | -0,41 | ||||
| 2026-02-06 | 13F | Lloyd Advisory Services, LLC. | 828 | 107 | ||||||
| 2026-02-12 | 13F/A | Pinebridge Investments Llc | 2.336 | 416 | ||||||
| 2026-02-13 | 13F | Dixon Mitchell Investment Counsel Inc. | 3.662 | 476 | ||||||
| 2026-02-02 | 13F | Intact Investment Management Inc. | 212.320 | -2,26 | 27.573 | -2,60 | ||||
| 2026-02-12 | 13F | Renaissance Technologies Llc | 164.995 | -33,41 | 21.415 | -33,65 | ||||
| 2026-02-06 | 13F | EverSource Wealth Advisors, LLC | 3.666 | 10,65 | 476 | 10,21 | ||||
| 2026-02-10 | 13F | Intech Investment Management Llc | 233.814 | 69,52 | 30.405 | 69,13 | ||||
| 2026-02-17 | 13F | Caisse De Depot Et Placement Du Quebec | 5.419.567 | 0,00 | 704.751 | -0,23 | ||||
| 2026-02-13 | 13F | Walleye Capital LLC | Call | 21.200 | 42,28 | 2.752 | 41,80 | |||
| 2026-02-13 | 13F | Walleye Capital LLC | Put | 25.200 | 149,50 | 3.271 | 148,67 | |||
| 2026-02-17 | 13F | BTG Pactual Asset Management US LLC | 0 | -100,00 | 0 | |||||
| 2026-02-13 | 13F | Walleye Capital LLC | 477 | 62 | ||||||
| 2026-02-18 | 13F | SkyView Investment Advisors, LLC | 1.878 | -27,74 | 0 | |||||
| 2026-04-20 | 13F | Cardinal Point Capital Management, ULC | 176.674 | -1,02 | 23.882 | 2,88 | ||||
| 2026-04-24 | 13F | Saxony Capital Management, LLC | 1.975 | 0,00 | 267 | 4,30 | ||||
| 2026-02-17 | 13F | NorthRock Partners, LLC | 17.186 | -2,24 | 2.231 | -2,58 | ||||
| 2026-04-20 | 13F | Jfs Wealth Advisors, Llc | 121 | 0,00 | 16 | 6,67 | ||||
| 2026-02-05 | 13F | Td Private Client Wealth Llc | 18.264 | -30,39 | 2.370 | -30,64 | ||||
| 2026-02-17 | 13F | Parallax Volatility Advisers, L.P. | Put | 65.000 | 0,00 | 8.436 | -0,35 | |||
| 2026-02-10 | 13F | Connor, Clark & Lunn Investment Management Ltd. | 2.069.545 | -9,22 | 268.763 | -9,51 | ||||
| 2026-02-17 | 13F | Parallax Volatility Advisers, L.P. | 1.250 | 162 | ||||||
| 2026-02-12 | 13F | Quadrant Capital Group Llc | 22.807 | 0,00 | 2.960 | -0,34 | ||||
| 2026-04-27 | 13F | Y-Intercept (Hong Kong) Ltd | 43.209 | 5.848 | ||||||
| 2026-01-09 | 13F | Silver Lake Advisory, LLC | 18.858 | 0,00 | 2.448 | -0,37 | ||||
| 2026-02-13 | 13F | JustInvest LLC | 21.501 | 4,24 | 2.791 | 3,87 | ||||
| 2026-02-17 | 13F | Mercer Global Advisors Inc /adv | 7.816 | 10,68 | 1.014 | 10,34 | ||||
| 2026-02-13 | 13F | Dynamic Technology Lab Private Ltd | 12.270 | 1.593 | ||||||
| 2026-01-07 | 13F | Sagespring Wealth Partners, Llc | 2.128 | -0,42 | 276 | -0,72 | ||||
| 2026-04-23 | 13F | J.w. Cole Advisors, Inc. | 2.228 | -2,02 | 302 | 2,03 | ||||
| 2026-02-17 | 13F | Fmr Llc | 6.597.931 | -18,53 | 856.858 | -18,81 | ||||
| 2026-02-18 | 13F | Mackenzie Financial Corp | 9.293.270 | -2,34 | 1.210.414 | -2,37 | ||||
| 2026-03-12 | 13F/A | Peak6 Llc | Put | 34.800 | 0,00 | 4.517 | -0,35 | |||
| 2026-04-09 | 13F | DHJJ Financial Advisors, Ltd. | 736 | 0,00 | 100 | 4,21 | ||||
| 2026-04-22 | 13F | Janney Montgomery Scott LLC | 16.862 | -14,77 | 2 | 0,00 | ||||
| 2026-03-12 | 13F/A | Peak6 Llc | Call | 500 | 0,00 | 65 | -1,54 | |||
| 2025-11-14 | 13F | Axa S.a. | 0 | -100,00 | 0 | |||||
| 2026-04-17 | 13F | Webster Bank, N. A. | 1.400 | 0,00 | 189 | 4,42 | ||||
| 2026-01-29 | 13F | Munich Reinsurance Co Stock Corp in Munich | 1.337 | 175 | ||||||
| 2026-02-09 | 13F | Buckhead Capital Management Llc | 1.854 | 5,94 | 241 | 5,73 | ||||
| 2026-02-17 | 13F | Jain Global LLC | 0 | -100,00 | 0 | |||||
| 2026-02-13 | 13F | Truvestments Capital Llc | 300 | -27,36 | 39 | -28,30 | ||||
| 2026-04-07 | 13F | Retirement Wealth Solutions LLC | 509 | -53,13 | 69 | -51,43 | ||||
| 2026-02-09 | 13F | Cary Street Partner Investment Advisory Llc | 393 | -46,46 | 51 | -46,32 | ||||
| 2026-01-23 | 13F | Assetmark, Inc | 14.053 | -20,46 | 1.824 | -20,77 | ||||
| 2026-02-06 | 13F | Pnc Financial Services Group, Inc. | 27.052 | -7,29 | 3.511 | -7,61 | ||||
| 2026-02-17 | 13F | Grantham, Mayo, Van Otterloo & Co. LLC | 131.825 | -20,01 | 17.142 | -20,20 | ||||
| 2026-04-10 | 13F | FORM Wealth Advisors, LLC | 1.527 | -1,55 | 207 | 2,49 | ||||
| 2026-04-07 | 13F | Five Oceans Advisors | 2.938 | 0,00 | 398 | 4,20 | ||||
| 2026-02-03 | 13F | Generali Asset Management SPA SGR | 86.672 | 15,02 | 15.449 | 13,06 | ||||
| 2026-02-12 | 13F | Sfam, Llc | 110 | 14 | ||||||
| 2026-02-06 | 13F | Associated Banc-corp | 8.888 | -44,83 | 1.154 | -45,04 | ||||
| 2026-02-17 | 13F | Susquehanna International Group, Llp | Call | 131.200 | -29,95 | 17.028 | -30,20 | |||
| 2026-04-07 | 13F | Farther Finance Advisors, LLC | 5.011 | 34,89 | 687 | 42,32 | ||||
| 2026-02-10 | 13F | Td Asset Management Inc | 19.372.601 | 1,54 | 2.519.180 | 1,31 | ||||
| 2026-02-17 | 13F | Cdkv Holdings Llc | 412 | 53 | ||||||
| 2026-02-17 | 13F | Susquehanna International Group, Llp | 7.085 | 286,95 | 920 | 286,13 | ||||
| 2026-02-17 | 13F | Susquehanna International Group, Llp | Put | 72.900 | -60,51 | 9.462 | -60,65 | |||
| 2026-01-20 | 13F | Stratos Wealth Partners, LTD. | 2.961 | 20,27 | 384 | 20,00 | ||||
| 2026-04-24 | 13F | Yousif Capital Management, Llc | 6.051 | 0,00 | 819 | 0,74 | ||||
| 2026-01-23 | 13F | Westside Investment Management, Inc. | 70 | 0,00 | 9 | 0,00 | ||||
| 2026-02-13 | 13F | Smartleaf Asset Management LLC | 724 | 77,89 | 94 | 80,77 | ||||
| 2026-04-14 | 13F | Nbc Securities, Inc. | 2.975 | -2,43 | 403 | 1,77 | ||||
| 2026-02-13 | 13F | Resources Management Corp /ct/ /adv | 9.395 | -0,90 | 1 | 0,00 | ||||
| 2026-02-09 | 13F | Blue Bell Private Wealth Management, Llc | 960 | 0,00 | 125 | -0,80 | ||||
| 2026-02-09 | 13F | Studio Investment Management Llc | 2.175 | 282 | ||||||
| 2026-02-17 | 13F | Agf Management Ltd | 637.754 | 75,86 | 94.286 | 58,19 | ||||
| 2026-01-23 | 13F | Nbt Bank N A /ny | 1.300 | -0,15 | 5.979 | -0,35 | ||||
| 2026-04-13 | 13F | Massmutual Trust Co Fsb/adv | 592 | -5,73 | 80 | -1,23 | ||||
| 2026-02-04 | 13F | Legacy Financial Advisors, Inc. | 4.101 | 28,00 | 532 | 27,58 | ||||
| 2026-04-13 | 13F | Mather Group, Llc. | 700 | 95 | ||||||
| 2026-02-03 | 13F | Lubar & Co., Inc | 0 | -100,00 | 0 | |||||
| 2026-02-12 | 13F | Nuveen, LLC | 533.388 | -0,23 | 69.361 | -0,46 | ||||
| 2026-04-17 | 13F | Bell Investment Advisors, Inc | 23 | 0,00 | 3 | 50,00 | ||||
| 2026-04-15 | 13F | Financial Management Professionals, Inc. | 275 | 58,96 | 37 | 68,18 | ||||
| 2026-01-28 | 13F | Mowery & Schoenfeld Wealth Management, LLC | 1 | 0,00 | 0 | |||||
| 2026-02-10 | 13F | Evolution Wealth Management Inc. | 18 | 2 | ||||||
| 2026-02-12 | 13F | Foster Dykema Cabot & Partners, Llc | 0 | -100,00 | 0 | |||||
| 2026-02-13 | 13F | Charles Schwab Investment Management Inc | 1.968.071 | 0,81 | 255.925 | 0,58 | ||||
| 2025-10-28 | 13F | Procyon Private Wealth Partners, LLC | 0 | -100,00 | 0 | |||||
| 2026-02-12 | 13F | Skandinaviska Enskilda Banken AB (publ) | 167.739 | 50,50 | 21.771 | 49,97 | ||||
| 2026-02-11 | 13F | Picton Mahoney Asset Management | 12.983 | -96,80 | 1.688 | 3.146,15 | ||||
| 2026-02-17 | 13F | Citadel Advisors Llc | Call | 323.100 | -33,46 | 41.935 | -33,70 | |||
| 2025-11-14 | 13F | ExodusPoint Capital Management, LP | 29.000 | 3.777 | ||||||
| 2026-02-02 | 13F | Horizon Investments, LLC | 6 | 1 | ||||||
| 2026-02-11 | 13F | Capital Analysts, Inc. | 60 | -84,46 | 0 | |||||
| 2026-02-12 | 13F | Brown Brothers Harriman & Co | 3.535 | 11,62 | 459 | 11,17 | ||||
| 2026-02-17 | 13F | Citadel Advisors Llc | Put | 515.500 | -2,81 | 66.907 | -3,15 | |||
| 2026-04-22 | 13F | Viewpoint Investment Partners Corp | 6.534 | 896 | ||||||
| 2026-01-23 | 13F | LOM Asset Management Ltd | 930 | 166 | ||||||
| 2026-02-04 | 13F | HighPoint Advisor Group LLC | 5.336 | -7,05 | 693 | -7,36 | ||||
| 2026-02-17 | 13F | Citadel Advisors Llc | 11.337 | 1.471 | ||||||
| 2026-02-17 | 13F | Captrust Financial Advisors | 8.417 | 0,84 | 1.092 | 0,46 | ||||
| 2026-04-22 | 13F | Pictet Asset Management Holding SA | 379.414 | -5,56 | 51.227 | -1,95 | ||||
| 2026-04-24 | 13F | Root Financial Partners, LLC | 29 | 314,29 | 4 | |||||
| 2026-02-20 | 13F | Kovitz Investment Group Partners, LLC | 0 | -100,00 | 0 | |||||
| 2026-02-11 | 13F | Capital Wealth Planning, LLC | 96.785 | 475,93 | 12.795 | 484,73 | ||||
| 2026-02-17 | 13F | Guardian Partners Inc. | 371.924 | 9,80 | 52.160 | 17,84 | ||||
| 2026-02-17 | 13F | Snowden Capital Advisors LLC | 2.306 | -16,11 | 299 | -16,48 | ||||
| 2025-11-14 | 13F | Mount Yale Investment Advisors, LLC | 0 | -100,00 | 0 | -100,00 | ||||
| 2026-01-29 | 13F | Ashton Thomas Private Wealth, LLC | 8.173 | 0,11 | 1.061 | -0,28 | ||||
| 2026-02-12 | 13F | CIBC Private Wealth Group, LLC | 1.999 | -8,89 | 259 | -9,12 | ||||
| 2026-02-04 | 13F | Biltmore Family Office, LLC | 4.360 | 0,00 | 566 | -0,35 | ||||
| 2026-04-09 | 13F | Lantz Financial LLC | 1.844 | -17,72 | 250 | -14,14 | ||||
| 2026-02-17 | 13F | Voleon Capital Management Lp | 2.216 | 288 | ||||||
| 2026-02-10 | 13F | IFG Advisory, LLC | 7.397 | 960 | ||||||
| 2026-02-13 | 13F | Integrated Wealth Concepts LLC | 0 | -100,00 | 0 | |||||
| 2026-02-05 | 13F | High Note Wealth, LLC | 1 | 0,00 | 0 | |||||
| 2026-01-20 | 13F | Savvy Advisors, Inc. | 1.870 | 2,13 | 243 | 1,68 | ||||
| 2026-01-27 | 13F | Jackson, Grant Investment Advisers, Inc. | 132 | 0,76 | 17 | 0,00 | ||||
| 2026-02-03 | 13F | Patten & Patten Inc/tn | 2.328 | 0,00 | 302 | -0,33 | ||||
| 2026-04-07 | 13F | Signaturefd, Llc | 11.353 | 5,96 | 1.537 | 10,50 | ||||
| 2026-02-12 | 13F | Richard W. Paul & Associates, LLC | 106 | -25,87 | 14 | -27,78 | ||||
| 2026-02-04 | 13F | LRI Investments, LLC | 150 | 0,00 | 19 | 0,00 | ||||
| 2025-11-12 | 13F | Erste Asset Management GmbH | 0 | -100,00 | 0 | -100,00 | ||||
| 2026-01-30 | 13F | Camden Capital, LLC | 4.200 | -6,21 | 545 | -6,52 | ||||
| 2025-11-21 | 13F | Oarsman Capital, Inc. | 0 | -100,00 | 0 | -100,00 | ||||
| 2026-02-09 | 13F | Annis Gardner Whiting Capital Advisors, LLC | 223 | 29 | ||||||
| 2026-02-12 | 13F | Aviva Plc | 610.264 | 5,45 | 79.315 | 5,28 | ||||
| 2026-02-12 | 13F | Barometer Capital Management Inc. | 0 | -100,00 | 0 | |||||
| 2026-02-18 | 13F | First Citizens Bank & Trust Co | 4.464 | 0,00 | 579 | -0,34 | ||||
| 2026-02-02 | 13F | KPP Advisory Services LLC | 0 | -100,00 | 0 | |||||
| 2025-11-14 | 13F | Voloridge Investment Management, Llc | 0 | -100,00 | 0 | |||||
| 2026-02-14 | 13F | Puzo Michael J | 3.500 | 0,00 | 454 | -0,22 | ||||
| 2026-01-27 | 13F | Berger Financial Group, Inc | 9.350 | 0,00 | 1.214 | -0,33 | ||||
| 2026-02-13 | 13F | Candriam Luxembourg S.C.A. | 209.417 | 15,98 | 27.233 | 15,72 | ||||
| 2026-01-27 | 13F | Zurcher Kantonalbank (Zurich Cantonalbank) | 299.918 | 3,00 | 39.001 | 2,76 | ||||
| 2026-02-09 | 13F | Bleakley Financial Group, LLC | 0 | -100,00 | 0 | |||||
| 2026-02-09 | 13F | Williamson Legacy Group, LLC | 0 | -100,00 | 0 | |||||
| 2026-01-29 | 13F | D.a. Davidson & Co. | 7.480 | 14,97 | 971 | 14,52 | ||||
| 2026-04-13 | 13F | Hm Payson & Co | 762 | 0,00 | 103 | 5,10 | ||||
| 2026-02-17 | 13F | Susquehanna Advisors Group, Inc. | 23.900 | 3.102 | ||||||
| 2026-04-06 | 13F | CX Institutional | 570 | 0,00 | 0 | |||||
| 2026-02-13 | 13F | Towarzystwo Funduszy Inwestycyjnych Pzu Sa | 0 | -100,00 | 0 | |||||
| 2026-02-17 | 13F | Maryland State Retirement & Pension System | 75.551 | -0,42 | 9.816 | -0,59 | ||||
| 2026-02-11 | 13F | SlateStone Wealth, LLC | 1.677 | 0,00 | 0 | |||||
| 2026-02-12 | 13F | Atlantic Family Wealth, Llc | 1.568 | -17,78 | 204 | -18,15 | ||||
| 2026-02-10 | 13F | Bank of New York Mellon Corp | 738.973 | -2,32 | 95.911 | -2,66 | ||||
| 2026-01-27 | 13F | Probity Advisors, Inc. | 11.785 | -4,74 | 1.530 | -5,09 | ||||
| 2026-01-29 | 13F | Concurrent Investment Advisors, LLC | 1.590 | 206 | ||||||
| 2026-02-06 | 13F | First Business Financial Services, Inc. | 2.462 | -1,20 | 320 | -1,54 | ||||
| 2026-02-13 | 13F | Ubs Asset Management Americas Inc | 284 | -98,09 | 37 | -98,14 | ||||
| 2026-02-02 | 13F | Truist Financial Corp | 64.797 | -20,21 | 8.410 | -20,50 | ||||
| 2026-02-10 | 13F | Bnp Paribas Arbitrage, Sa | 14.999 | -46,65 | 1.947 | -46,86 | ||||
| 2025-10-31 | 13F | Whittier Trust Co Of Nevada Inc | 0 | -100,00 | 0 | |||||
| 2026-02-17 | 13F | Mairs & Power Inc | 6.746 | 0,00 | 876 | -0,34 | ||||
| 2026-02-17 | 13F | Twinbeech Capital Lp | 3.001 | 390 | ||||||
| 2026-02-17 | 13F | DZ BANK AG Deutsche Zentral Genossenschafts Bank, Frankfurt am Main | 12.700 | 1.649 | ||||||
| 2026-04-03 | 13F | Investors Research Corp | 0 | -100,00 | 0 | |||||
| 2026-02-17 | 13F | Glenmede Trust Co Na | 6.565 | 62,54 | 852 | 121,30 | ||||
| 2025-11-10 | 13F | Optiver Holding B.V. | 0 | -100,00 | 0 | |||||
| 2026-02-13 | 13F | Neuberger Berman Group LLC | 212.172 | 14,34 | 27.590 | 14,07 | ||||
| 2026-02-13 | 13F | Wealth Alliance | 6.425 | -25,23 | 834 | -25,56 | ||||
| 2026-02-10 | 13F | Operose Advisors LLC | 1.093 | 69,98 | 142 | 69,88 | ||||
| 2026-04-20 | 13F | Ronald Blue Trust, Inc. | 133 | 0,00 | 18 | 5,88 | ||||
| 2026-02-13 | 13F | Mml Investors Services, Llc | 28.785 | -14,98 | 3.736 | -15,29 | ||||
| 2026-01-29 | 13F | Quest 10 Wealth Builders, Inc. | 6 | -25,00 | 1 | -100,00 | ||||
| 2026-02-06 | 13F | Cumberland Partners Ltd | 41.008 | 89,61 | 5.329 | 89,17 | ||||
| 2026-02-04 | 13F | Midwest Trust Co | 5.380 | 12,22 | 698 | 11,86 | ||||
| 2025-11-13 | 13F | Twin Tree Management, LP | 0 | -100,00 | 0 | -100,00 | ||||
| 2026-04-15 | 13F | FNY Investment Advisers, LLC | 0 | -100,00 | 0 | |||||
| 2026-04-10 | 13F | Magnus Financial Group LLC | 2.295 | -2,01 | 311 | 2,31 | ||||
| 2026-02-17 | 13F | D. E. Shaw & Co., Inc. | 1.434.421 | 26,38 | 186.285 | 25,99 | ||||
| 2026-02-03 | 13F | Crossmark Global Holdings, Inc. | 15.976 | -35,15 | 2.074 | -35,38 | ||||
| 2026-02-17 | 13F | D. E. Shaw & Co., Inc. | Call | 478.700 | -19,02 | 62.174 | -19,26 | |||
| 2026-02-17 | 13F/A | Northwest & Ethical Investments L.P. | 146.858 | 3,30 | 19.073 | 2,98 | ||||
| 2025-11-14 | 13F | Skopos Labs, Inc. | 0 | -100,00 | 0 | |||||
| 2026-02-17 | 13F | D. E. Shaw & Co., Inc. | Put | 1.828.400 | 11,94 | 237.476 | 11,60 | |||
| 2026-02-04 | 13F | Plato Investment Management Ltd | 469 | -46,70 | 61 | -46,02 | ||||
| 2026-02-12 | 13F | Commonwealth Equity Services, Llc | 37.770 | -8,81 | 4.902 | 97.940,00 | ||||
| 2026-02-06 | 13F | Bare Financial Services, Inc | 69 | 0,00 | 9 | 0,00 | ||||
| 2026-02-05 | 13F | SkyOak Wealth, LLC | 1.700 | 0,00 | 221 | -0,45 | ||||
| 2026-02-18 | 13F/A | Pinnacle Financial Partners, Inc. | 107.173 | 13.910 | ||||||
| 2026-01-23 | 13F | Smith, Moore & Co. | 2.636 | 0,00 | 342 | -0,29 | ||||
| 2026-02-12 | 13F | Swiss Re Ltd | 290 | 38 | ||||||
| 2026-02-11 | 13F | Franklin Resources Inc | 317.254 | 6,09 | 41.201 | 6,15 | ||||
| 2026-02-13 | 13F | SRS Capital Advisors, Inc. | 1.358 | -20,82 | 176 | -21,08 | ||||
| 2026-02-11 | 13F | Deutsche Bank Ag\ | 1.450.662 | 5,47 | 188.281 | 5,10 | ||||
| 2026-02-12 | 13F | Callan Family Office, LLC | 7.837 | 338,56 | 1.017 | 338,36 | ||||
| 2026-02-13 | 13F | Mufg Securities (canada), Ltd. | 1.083.543 | -8,59 | 140.749 | -8,87 | ||||
| 2026-04-22 | 13F | JNBA Financial Advisors | 440 | 0,00 | 60 | 3,51 | ||||
| 2026-02-13 | 13F | Evelyn Partners Investment Management LLP | 2.064 | 0,00 | 268 | 0,00 | ||||
| 2026-02-13 | 13F | Pinnacle Wealth Planning Services, Inc. | 107 | 14 | ||||||
| 2026-01-12 | 13F | CVA Family Office, LLC | 2.512 | 0,00 | 326 | -0,31 | ||||
| 2026-02-09 | 13F | Genus Capital Management Inc. | 27.522 | 0,48 | 3.579 | 0,22 | ||||
| 2026-02-10 | 13F | MUFG Securities EMEA plc | 0 | -100,00 | 0 | |||||
| 2026-04-21 | 13F | Maseco Llp | 36 | 5 | ||||||
| 2026-02-12 | 13F | Sand Hill Global Advisors, LLC | 4.682 | 2,47 | 608 | 2,02 | ||||
| 2026-02-02 | 13F | Fifth Third Bancorp | 3.087 | -9,89 | 401 | -10,31 | ||||
| 2026-02-12 | 13F | Penserra Capital Management LLC | 45 | 0,00 | 0 | |||||
| 2026-02-17 | 13F | Sciencast Management LP | 27.367 | -3,01 | 3.552 | -3,37 | ||||
| 2026-02-18 | 13F | GWM Advisors LLC | 2.640 | -15,92 | 343 | -16,18 | ||||
| 2026-04-14 | 13F | SNS Financial Group, LLC | 2.048 | 0,79 | 277 | 5,32 | ||||
| 2026-02-11 | 13F | Syon Capital Llc | 7.795 | 1.012 | ||||||
| 2026-04-16 | 13F | Rockland Trust Co | 3.243 | 0,00 | 439 | 4,29 | ||||
| 2026-02-09 | 13F | Geode Capital Management, Llc | 7.030.219 | 6,72 | 932.242 | 6,73 | ||||
| 2026-02-17 | 13F | Vertex Planning Partners, LLC | 31.959 | 0,00 | 4.148 | -0,36 | ||||
| 2026-01-30 | 13F | Bogart Wealth, LLC | 2.381 | 8,13 | 309 | 8,04 | ||||
| 2026-02-13 | 13F | Walleye Trading LLC | Put | 10.700 | 22,99 | 1.389 | 22,51 | |||
| 2025-11-14 | 13F | Wetherby Asset Management Inc | 15.229 | 0,11 | 1.984 | 17,90 | ||||
| 2026-02-13 | 13F | Walleye Trading LLC | Call | 25.400 | -41,07 | 3.297 | -41,28 | |||
| 2026-02-03 | 13F | Ballentine Partners, LLC | 1.805 | 1,40 | 234 | 1,30 | ||||
| 2026-02-10 | 13F | Private Wealth Asset Management, LLC | 12 | 0,00 | 2 | 0,00 | ||||
| 2026-04-16 | 13F | Diversified Trust Co | 3.161 | 15,36 | 428 | 20,28 | ||||
| 2026-02-13 | 13F | Barclays Plc | 28.846 | 1,58 | 3.744 | 1,22 | ||||
| 2026-02-10 | 13F | IAG Wealth Partners, LLC | 335 | 0,00 | 43 | 0,00 | ||||
| 2026-02-12 | 13F | Ensign Peak Advisors, Inc | 30.829 | 0,00 | 4.009 | -0,25 | ||||
| 2026-02-23 | 13F | Virtu Financial LLC | 0 | -100,00 | 0 | |||||
| 2025-11-07 | 13F | Shell Asset Management Co | 18.611 | -35,85 | 2 | -33,33 | ||||
| 2026-01-27 | 13F | Evergreen Capital Management Llc | 4.112 | -6,10 | 534 | -6,49 | ||||
| 2026-02-06 | 13F | HighTower Advisors, LLC | 28.428 | -1,43 | 3.690 | -1,78 | ||||
| 2026-02-10 | 13F | Riverpoint Wealth Management Holdings, LLC | 2.075 | 0,00 | 269 | -0,37 | ||||
| 2026-02-03 | 13F | ASR Vermogensbeheer N.V. | 22.213 | 0,00 | 2.888 | -0,24 | ||||
| 2026-02-10 | 13F | CIBC World Markets Inc. | 12.551.773 | 0,86 | 1.630.224 | 0,55 | ||||
| 2026-02-10 | 13F | CIBC World Markets Inc. | Put | 650.000 | 0,00 | 84.422 | -0,31 | |||
| 2026-02-06 | 13F | Wrapmanager Inc | 0 | -100,00 | 0 | |||||
| 2026-01-20 | 13F | Ascent Group, LLC | 2.394 | 0,72 | 311 | 0,32 | ||||
| 2026-02-12 | 13F | Bank Of Montreal /can/ | Put | 351.700 | 134,47 | 45.675 | 133,74 | |||
| 2026-02-10 | 13F | Rothschild Investment Llc | 507 | 0,80 | 66 | 0,00 | ||||
| 2026-02-12 | 13F | Bank Of Montreal /can/ | Call | 31.200 | -9,57 | 4.052 | -9,86 | |||
| 2026-02-09 | 13F | North Star Asset Management Inc | 8.099 | -0,92 | 1.051 | -1,22 | ||||
| 2026-02-12 | 13F | Bank Of Montreal /can/ | 28.165.528 | -1,18 | 3.657.869 | -1,49 | ||||
| 2026-02-17 | 13F | Advisor Group Holdings, Inc. | 20.869 | -2,11 | 2.711 | 2,50 | ||||
| 2026-02-11 | 13F | Parallel Advisors, LLC | 2.759 | 0,04 | 358 | -0,28 | ||||
| 2026-03-13 | 13F | Fund Advisors of America Inc/FL | 2.185 | 284 | ||||||
| 2026-04-10 | 13F | First Bank & Trust | 17.295 | 0,93 | 2.341 | 5,26 | ||||
| 2026-04-23 | 13F | Forum Financial Management, LP | 0 | -100,00 | 0 | |||||
| 2026-02-09 | 13F | Waratah Capital Advisors Ltd. | 25.894 | -71,40 | 3.361 | -71,51 | ||||
| 2026-02-09 | 13F | Legal & General Group Plc | 4.550.324 | 0,54 | 591.714 | 0,31 | ||||
| 2026-02-09 | 13F | Jefferies Financial Group Inc. | 479.492 | 6.300,05 | 62.233 | 6.282,87 | ||||
| 2026-04-23 | 13F | North Star Investment Management Corp. | 2.425 | 0,33 | 328 | 4,79 | ||||
| 2026-02-17 | 13F | Modern Wealth Management, LLC | 1.748 | 227 | ||||||
| 2026-01-30 | 13F | Trifecta Capital Advisors, LLC | 0 | -100,00 | 0 | |||||
| 2025-11-21 | 13F | Nebula Research & Development LLC | 0 | -100,00 | 0 | |||||
| 2026-02-13 | 13F | Sei Investments Co | 0 | -100,00 | 0 | |||||
| 2026-03-06 | 13F | Hsbc Holdings Plc | 0 | -100,00 | 0 | |||||
| 2026-02-03 | 13F | Winch Advisory Services, LLC | 350 | 0,00 | 45 | 0,00 | ||||
| 2026-02-13 | 13F | Bank Of Nova Scotia | 5.965.369 | -6,41 | 774.681 | -6,73 | ||||
| 2026-02-13 | 13F | Citigroup Inc | 528.447 | 5,19 | 68.718 | 4,95 | ||||
| 2026-02-09 | 13F | Mediolanum International Funds Ltd | 3.764 | 23,21 | 492 | 23,99 | ||||
| 2026-02-10 | 13F | Sivia Capital Partners, LLC | 2.238 | 290 | ||||||
| 2026-02-17 | 13F | Lombard Odier Asset Management (Switzerland) SA | 48.196 | 350,60 | 6.259 | 349,64 | ||||
| 2026-02-12 | 13F | Rossby Financial, LCC | 27 | 12,50 | 4 | 0,00 | ||||
| 2026-04-23 | 13F | Avant Financial Advisors LLC | 4.160 | 0,00 | 563 | 4,45 | ||||
| 2026-04-08 | 13F | Thompson Investment Management, Inc. | 972 | -13,37 | 132 | -9,66 | ||||
| 2026-02-10 | 13F | Texas Yale Capital Corp. | 12.413 | 0,00 | 1.611 | -0,31 | ||||
| 2025-11-14 | 13F | Aigen Investment Management, Lp | 0 | -100,00 | 0 | -100,00 | ||||
| 2026-02-12 | 13F | BlackRock, Inc. | 644.302 | 0,49 | 83.624 | 0,13 | ||||
| 2026-04-17 | 13F | Watershed Private Wealth Llc | 4.000 | 0,00 | 541 | 4,24 | ||||
| 2026-02-10 | 13F | CIBC World Markets Inc. | Call | 0 | -100,00 | 0 | -100,00 | |||
| 2026-02-10 | 13F | Norges Bank | 8.156.958 | 1.059.320 | ||||||
| 2025-11-12 | 13F | Cobblestone Capital Advisors Llc /ny/ | 2.000 | -9,09 | 260 | 7,00 |